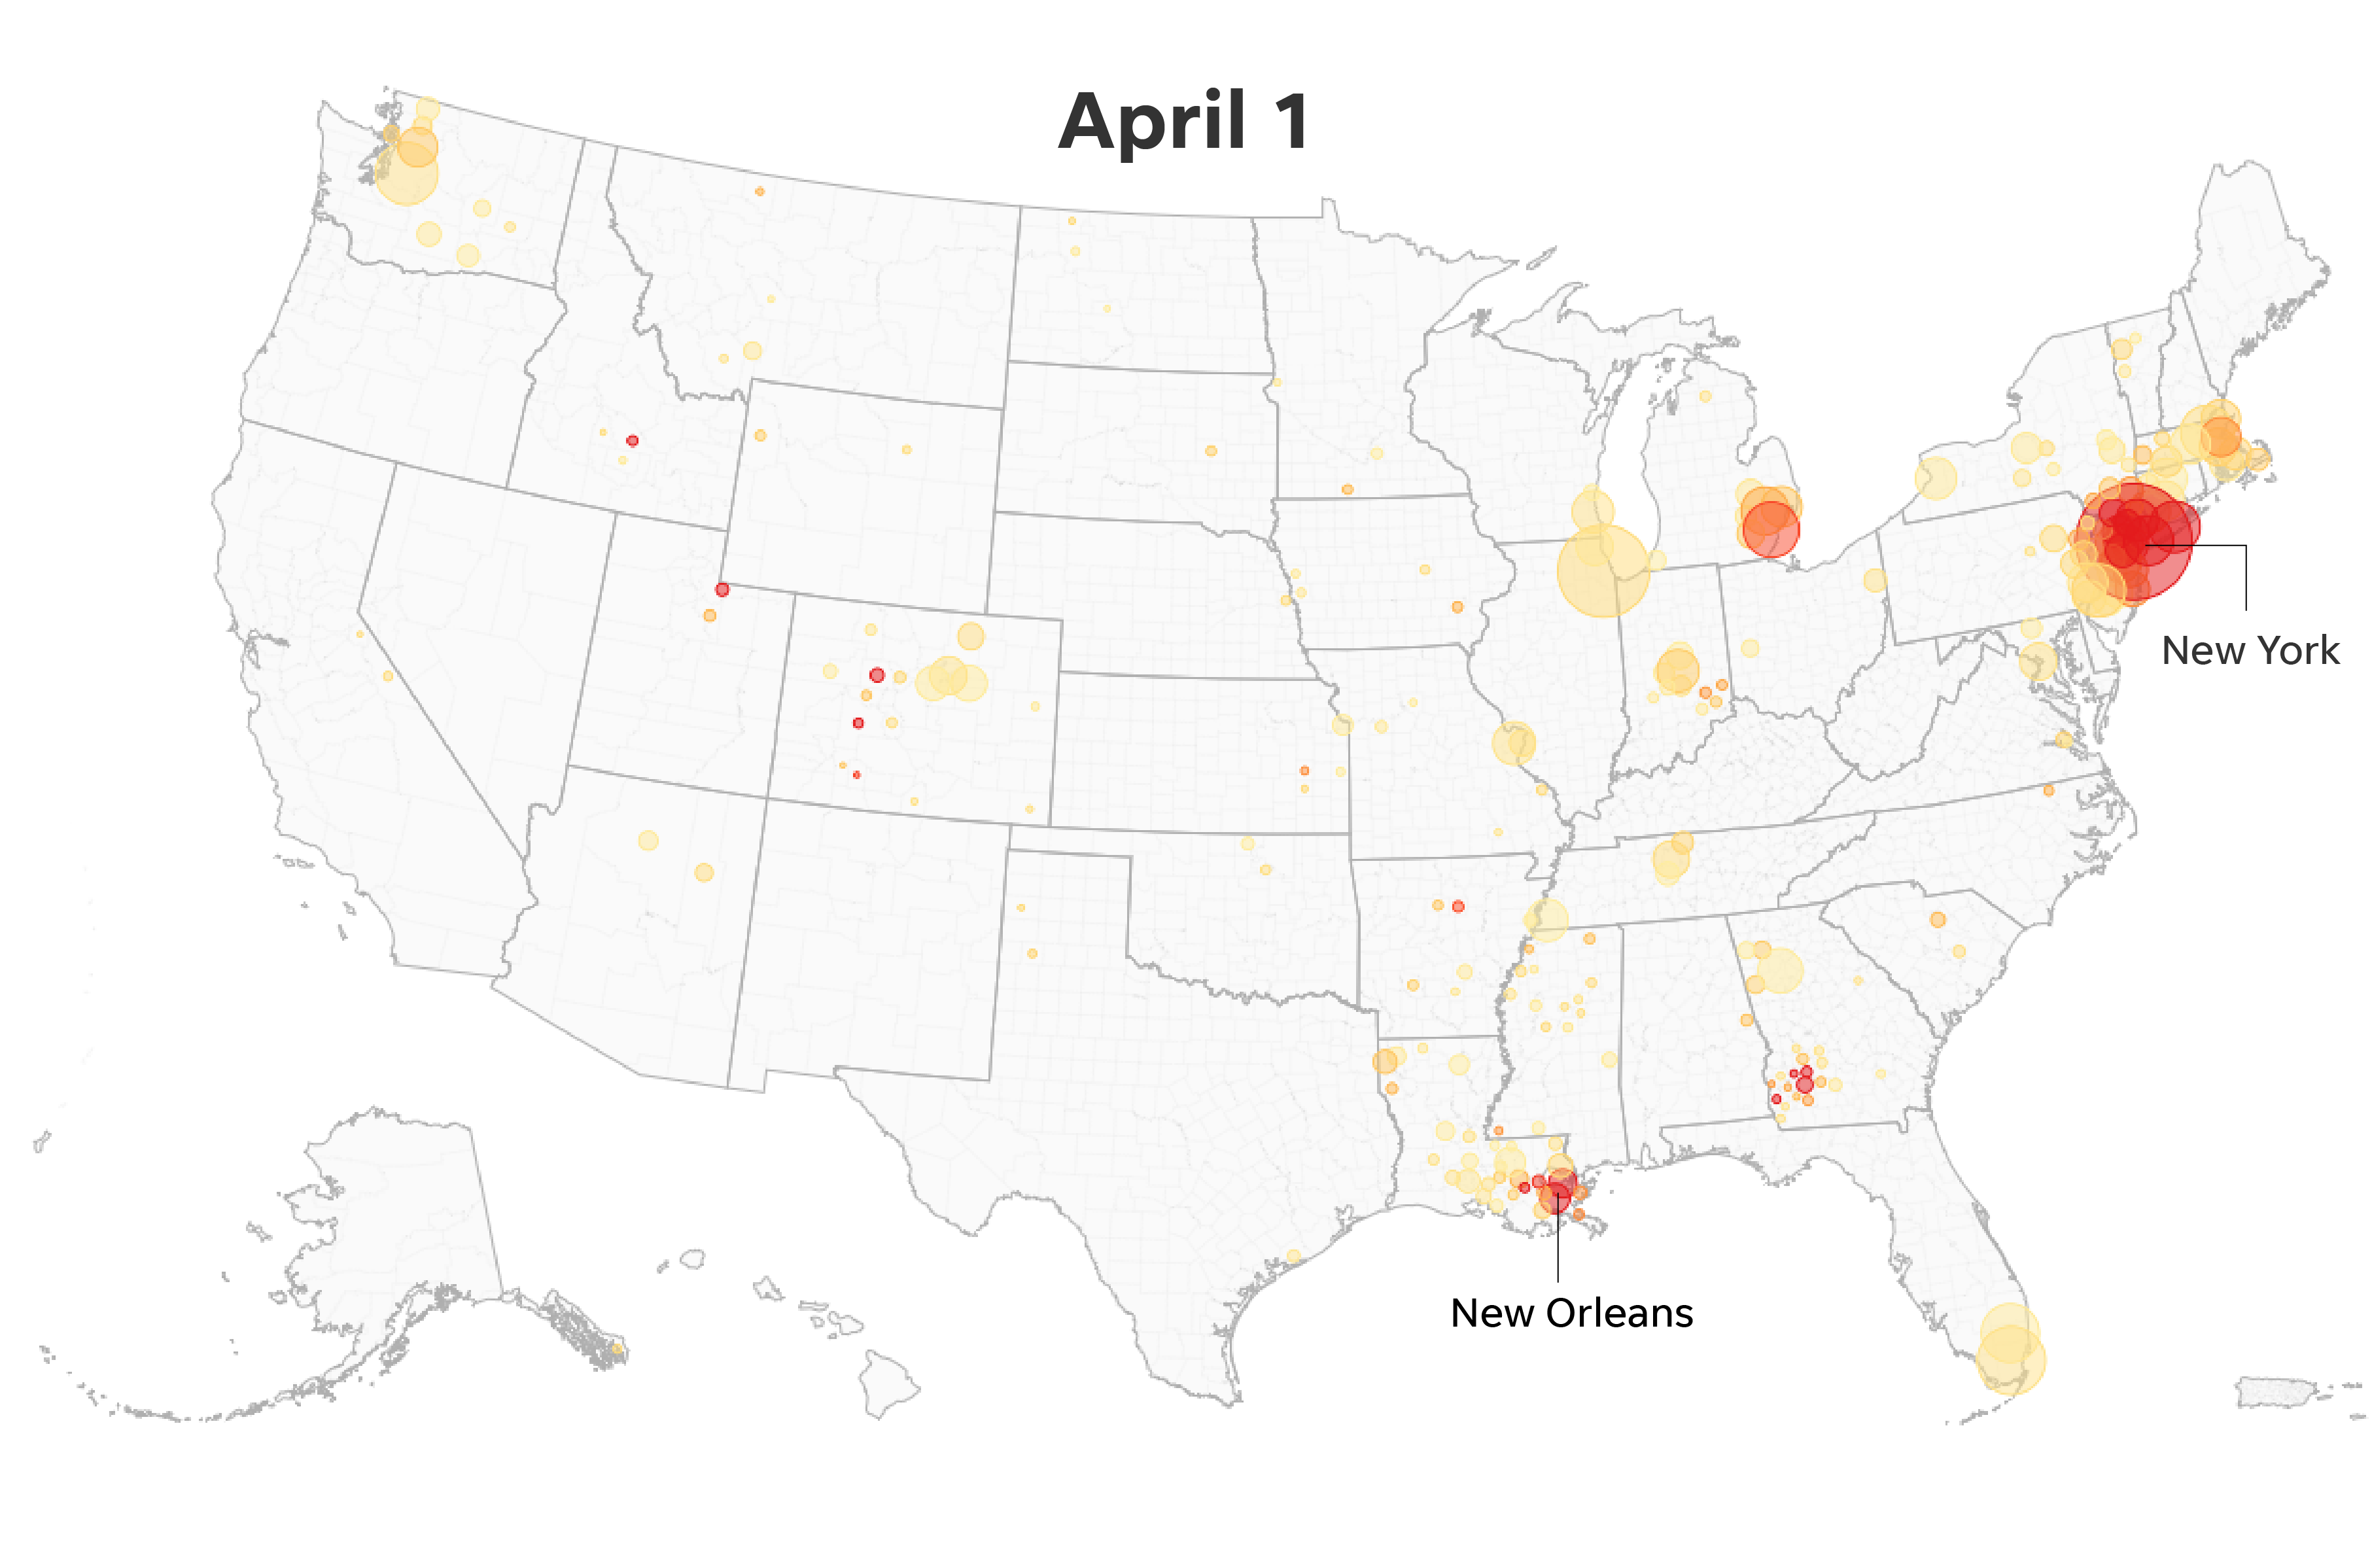

Each circle represents one county or territory. Only counties or territories with growth of over 50 new cases per 100,000 people in the preceding two weeks of the given date appear on each map.
SOURCE Johns Hopkins University; USA TODAY analysis
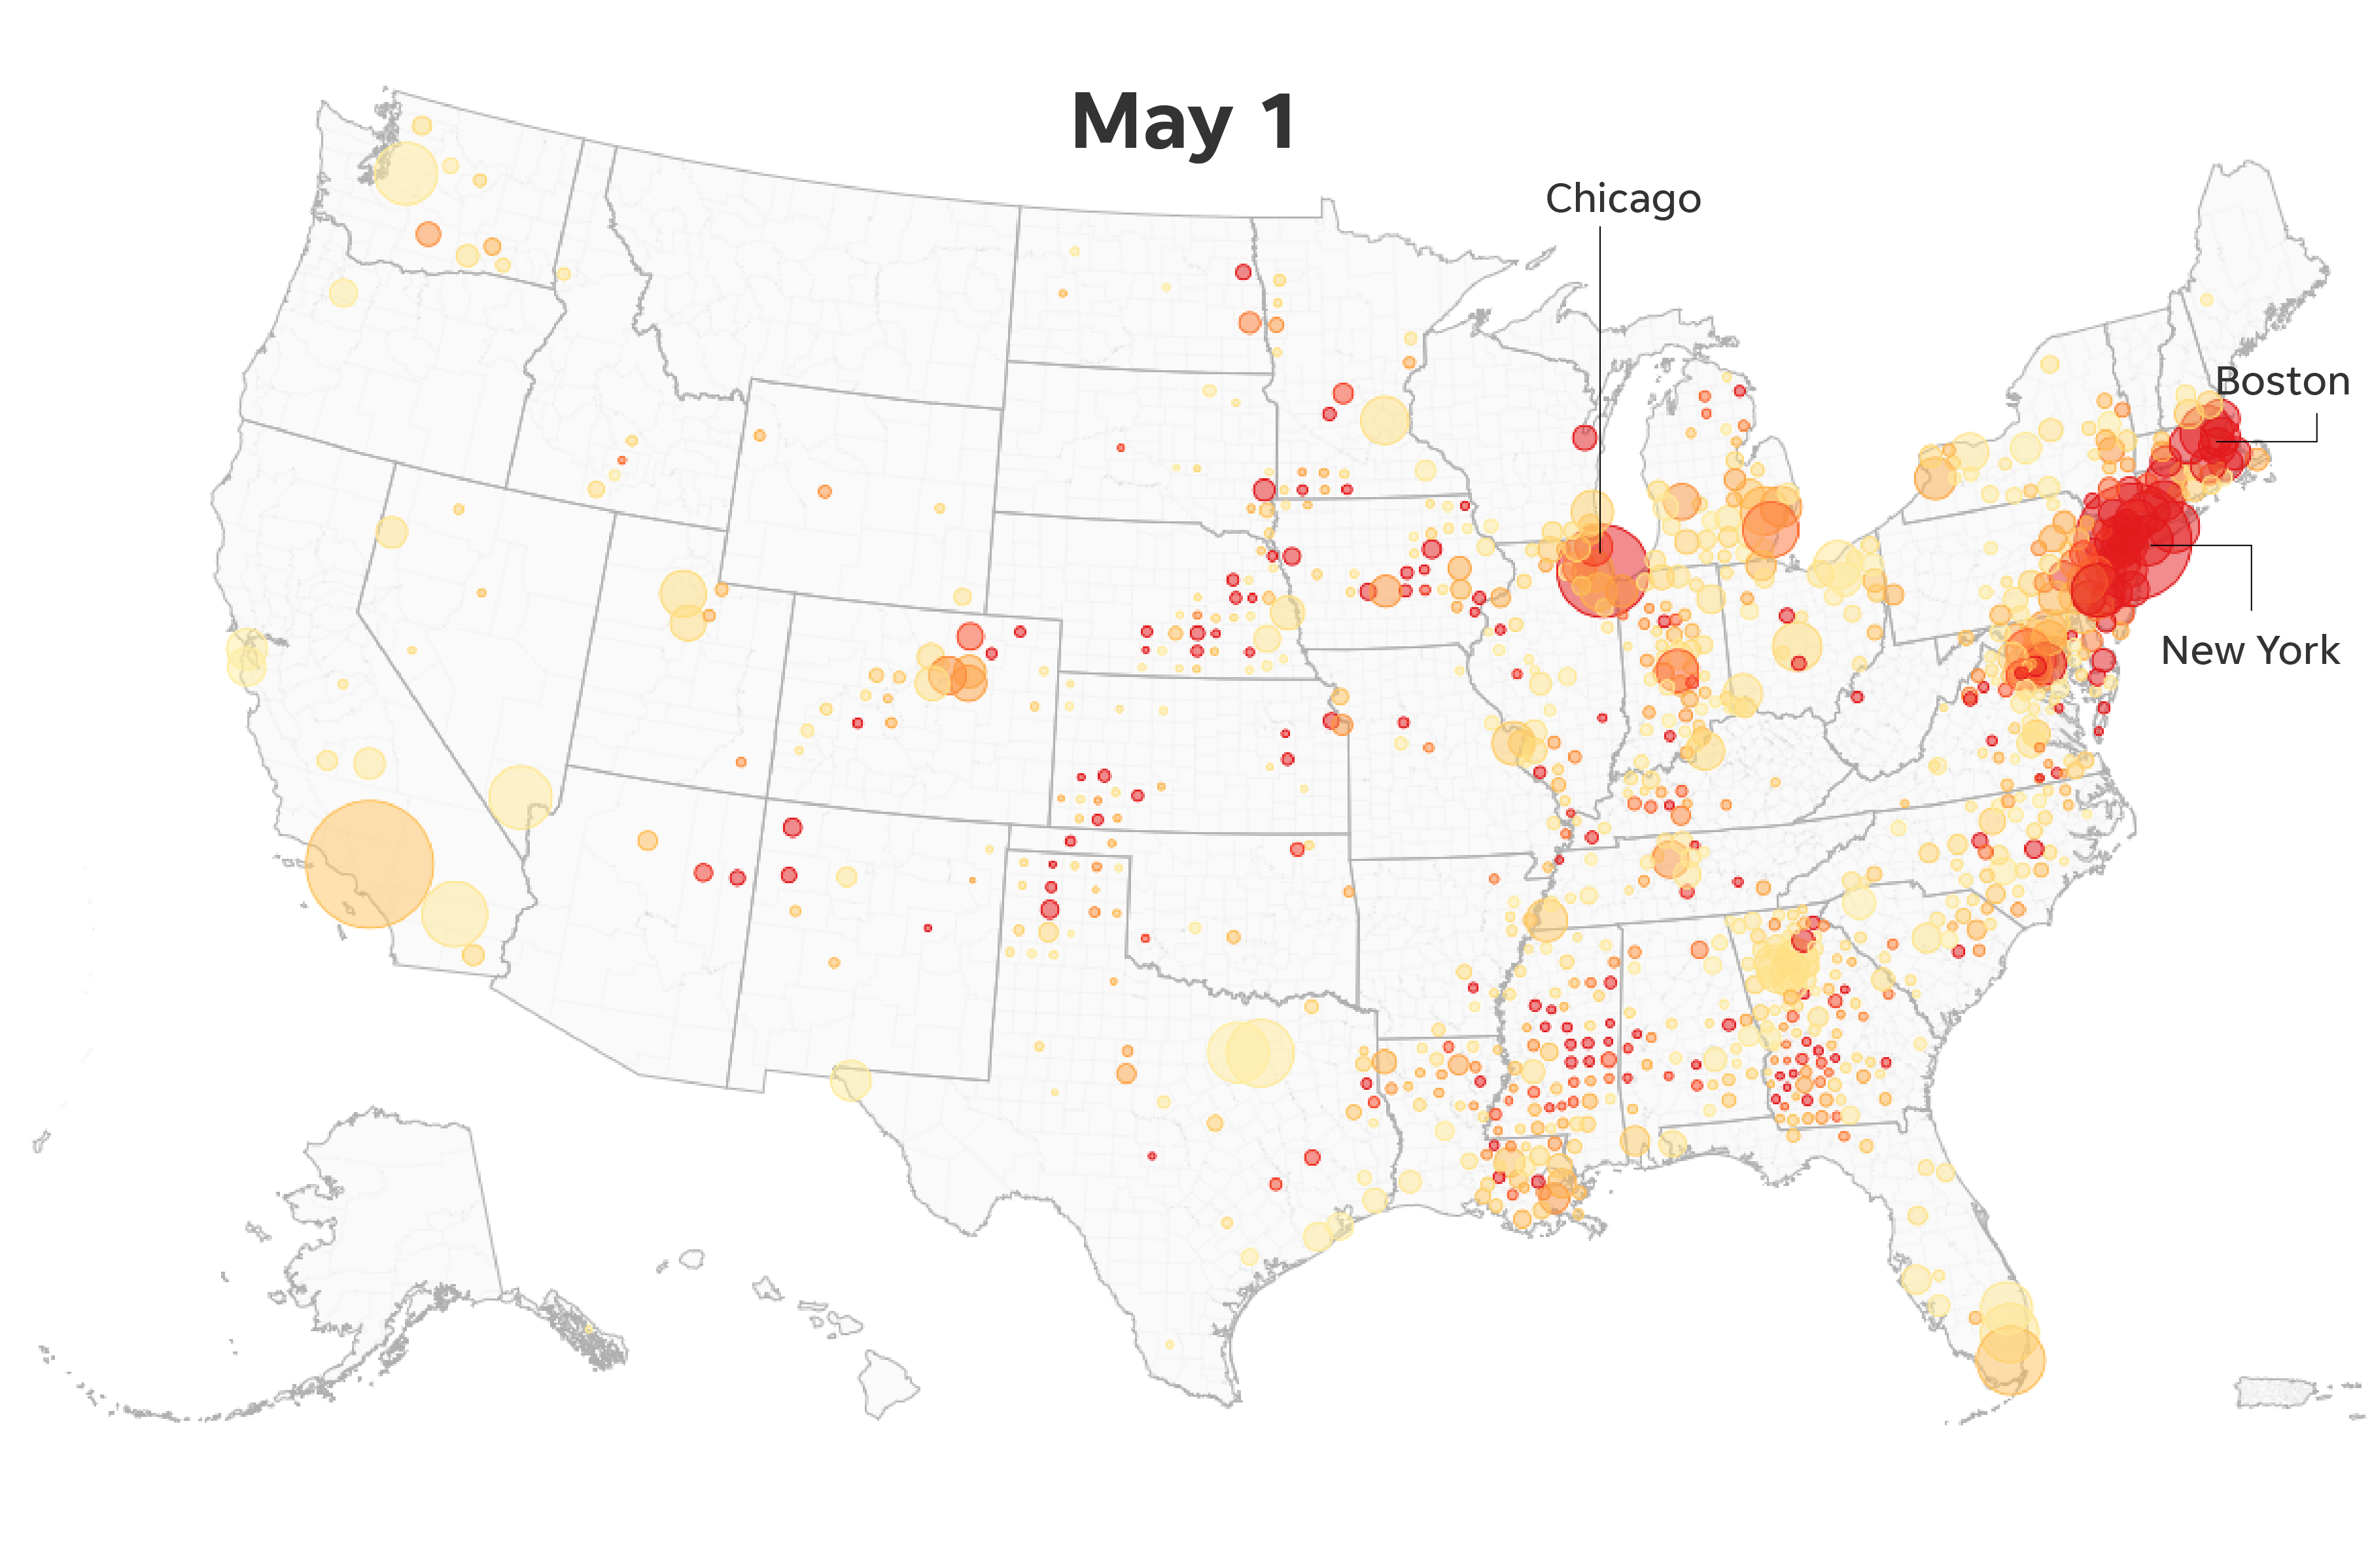
Each circle represents one county or territory. Only counties or territories with growth of over 50 new cases per 100,000 people in the preceding two weeks of the given date appear on each map.
SOURCE Johns Hopkins University; USA TODAY analysis